
Last Updated on July 28, 2026 by Digiinte.com Team
A slow website costs you more than an awkward waiting screen. Visitors leave, conversions drop, and Google factors page experience directly into how your site ranks. The tricky part is that most speed testing tools tell you a score without clearly explaining what to actually do about it.
- Key Takeaways
- How These Tools Actually Measure Speed
- 1. Google PageSpeed Insights
- 2. GTmetrix
- 3. WebPageTest
- 4. Pingdom
- 5. KeyCDN Website Speed Test
- 6. Yellow Lab Tools
- How to Fix Slow Load Times: The Real Causes
- Quick Diagnostic Checklist
- Why This Connects to Your Broader SEO Health
- Frequently Asked Questions
- Conclusion
This guide covers the 6 best website speed testing tools, what each one measures, its real strengths and limitations, and then walks through exactly how to fix the slow load time issues these tools commonly uncover, since a score without a fix is not particularly useful on its own.
Key Takeaways
- Google PageSpeed Insights remains the most important starting point, since it reflects the same Core Web Vitals data Google uses for ranking.
- GTmetrix and WebPageTest both offer detailed waterfall charts showing exactly which resources delay your page, useful once you need to go deeper than a single score.
- Pingdom is built for ongoing monitoring over time, not just a one-off test, useful for catching regressions after site changes.
- KeyCDN Tools focuses specifically on asset delivery and CDN performance, a narrower but genuinely useful specialty.
- Yellow Lab Tools stands out by analyzing frontend code quality, not just raw speed, catching issues other tools often miss.
- Most slow load time problems come down to a handful of repeat causes, oversized images, render-blocking scripts, slow server response time, and too many requests.
- Fixing the underlying cause matters more than chasing a perfect score, since a high score does not always match what real visitors actually experience.
How These Tools Actually Measure Speed
Before comparing tools, it helps to understand the two different types of data they rely on. Lab data comes from a synthetic, simulated test run in a controlled environment, this is what Lighthouse-based tools produce. Field data, sometimes called Real User Monitoring, comes from actual visitors experiencing your site in real conditions. Lab data is useful for consistent, repeatable testing and diagnosing specific issues, while field data reflects what real users on real networks and devices actually experience. The strongest approach uses both, lab data to diagnose and fix issues, field data to confirm the fix actually helped real visitors.
1. Google PageSpeed Insights
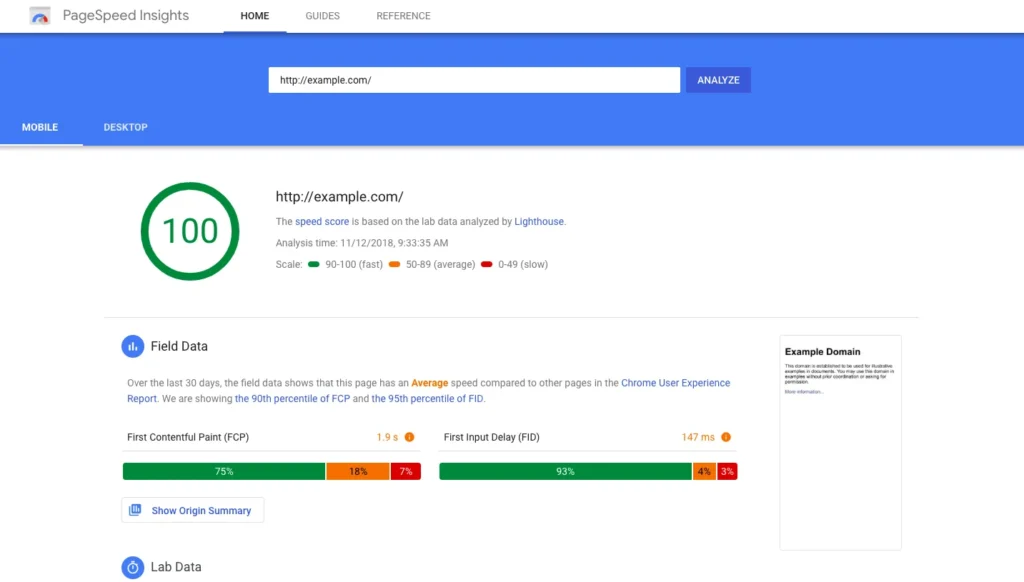
PageSpeed Insights remains the most important speed tool available, largely because it comes directly from Google and reflects the same Core Web Vitals signals that factor into search rankings. Built and maintained by Google itself, it has become the de facto starting point for anyone checking their site’s performance, since it draws on the exact same underlying Lighthouse engine that powers Chrome’s own developer tools, and the exact same Core Web Vitals thresholds Google uses when evaluating page experience across the web. Because of this direct connection to Google’s own evaluation criteria, a good score here carries more weight than a good score from most third-party alternatives, even when the underlying issue being measured is technically similar.
What It Does: Enter a URL and it returns a performance score for both mobile and desktop separately, combining lab data from a simulated test with real field data collected from actual Chrome users who have visited the page, when enough traffic exists to provide it.
Key Features: Below the score, it lists specific, prioritized Opportunities and Diagnostics, each with an estimated time savings, turning a vague “make it faster” goal into a concrete checklist.
Pricing: Completely free, with no account or signup required.
Pros:
- Directly reflects Google’s own ranking-relevant Core Web Vitals data
- Combines both lab and field data in a single report
- Specific, actionable recommendations rather than just a raw score
Cons:
- Field data is only available for pages with sufficient real-world traffic
- Does not provide a detailed waterfall view of individual resource loading
- Score can vary somewhat between test runs due to normal fluctuation
Best for: Establishing a baseline understanding of Core Web Vitals and ranking-relevant performance signals.
2. GTmetrix
GTmetrix has long been a favorite for its detailed waterfall chart, showing the complete sequence of every request your page makes. It has built a loyal following over the years specifically among developers and site owners who find a single numeric score too vague to act on, since seeing the actual sequence of every image, script, and stylesheet loading, side by side, makes it far easier to spot exactly where time is being lost. Where a plain score tells you something is slow, GTmetrix’s visual approach tends to make the specific culprit obvious almost immediately, without needing to guess or run additional diagnostic steps.
What It Does: Runs a test from a selected server location and browser, returning a performance grade alongside a full waterfall breakdown of every asset loaded, how long each one took, and in what order.
Key Features: The waterfall view makes it easy to visually spot a single oversized image or a slow third-party script blocking everything after it, something a simple numeric score cannot show on its own.
Pricing: A free account covers basic testing from a limited set of locations. Paid tiers add more test locations, scheduled monitoring, and video capture of the page loading.
Pros:
- Detailed waterfall view makes bottlenecks visually obvious
- Clear grading system alongside specific fix recommendations
- Free tier is genuinely usable for occasional testing
Cons:
- Free tier limits which server locations you can test from
- Scheduled, ongoing monitoring requires a paid plan
- Grading can occasionally overweight minor issues relative to real user impact
Best for: Visually diagnosing exactly which specific resource is slowing down a page.

3. WebPageTest
WebPageTest offers some of the most advanced, granular testing options available, popular among developers who need deep control over test conditions. Originally built by AOL and later open sourced, it has developed a reputation as the tool serious performance engineers reach for when a simpler test does not provide enough detail to actually solve a stubborn problem. Rather than giving you one simulated result from one location, it lets you closely replicate the actual conditions your real users experience, a specific city, a specific device, a specific connection speed, which matters enormously when a site performs fine in testing but poorly for a particular segment of real visitors.
What It Does: Lets you test from dozens of real global locations, on real device and browser combinations, with configurable connection speeds, and even runs each test multiple times to check for consistency between DNS lookups and server responses.
Key Features: The repeat-view testing feature shows how much faster a page loads on a second visit thanks to caching, a detail many simpler tools skip entirely.
Pricing: Free to use, with the option to run tests on private instances for organizations needing more control or privacy.
Pros:
- Extremely granular control over test location, device, and connection type
- Multiple test runs help distinguish real issues from one-off network flukes
- Repeat-view testing reveals caching effectiveness clearly
Cons:
- Interface and terminology can feel overwhelming for casual users
- Takes noticeably longer to run a full test compared to simpler tools
- Requires more manual interpretation to turn results into a fix
Best for: Developers who need precise control over test conditions and deeper technical diagnostics.

4. Pingdom
Pingdom shifts the focus from a single test toward ongoing monitoring, tracking your site’s speed and uptime continuously over time. Where most tools on this list answer the question of how fast your site is right now, Pingdom is built around a different, arguably more practical question for an actively maintained site, whether your site is still performing well next week, next month, and after every change you make in between. This shift toward continuous tracking rather than a one-off snapshot makes it especially valuable for teams managing a site that changes frequently, where a slowdown could otherwise go unnoticed for weeks.
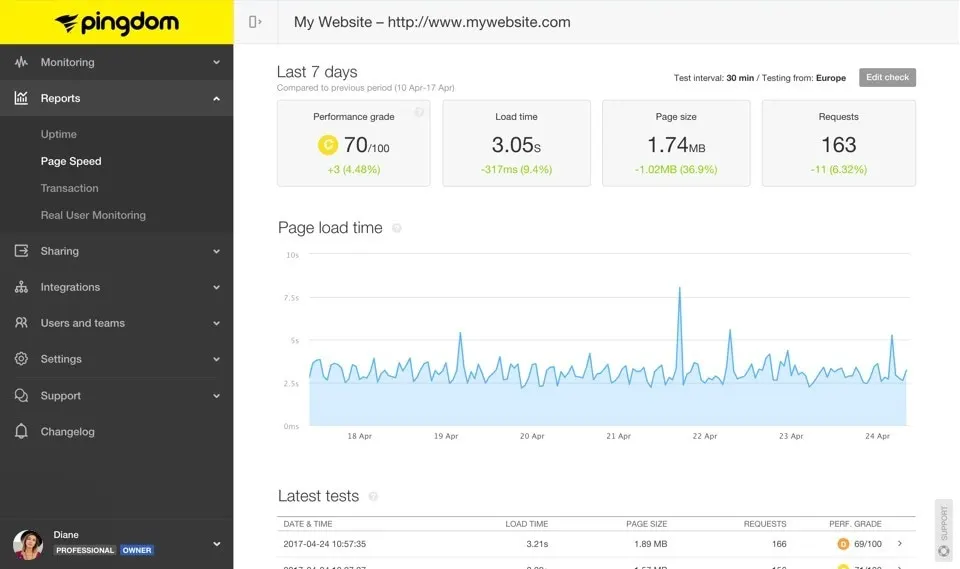
What It Does: Beyond a one-time speed test with a waterfall view and grade, Pingdom’s monitoring service checks your site at regular intervals from multiple locations, alerting you if load time or uptime suddenly degrades.
Key Features: Historical trend graphs make it easy to spot exactly when a site started slowing down, often correlating with a specific plugin update, theme change, or traffic spike.
Pricing: A free one-time speed test is available. Ongoing monitoring requires a paid subscription based on how many sites and how frequently you want checks performed.
Pros:
- Historical tracking makes it easy to correlate slowdowns with specific site changes
- Alerts catch regressions quickly rather than discovering them by accident later
- Combines speed testing with broader uptime monitoring in one tool
Cons:
- Meaningful ongoing monitoring requires a paid plan
- The free one-time test is less detailed than dedicated tools like GTmetrix
- Historical data only becomes useful after monitoring has run for a while
Best for: Ongoing monitoring to catch speed regressions after site changes, not just a single point-in-time check.
5. KeyCDN Website Speed Test
KeyCDN’s free tool takes a narrower focus specifically on asset delivery and CDN related performance factors. As a company that itself provides CDN services, KeyCDN built this tool with a clear specialty in mind, helping site owners understand exactly how efficiently their static assets, images, stylesheets, scripts, are being delivered across different geographic regions. This makes it less of a general, all-purpose speed checker and more of a targeted diagnostic instrument for anyone trying to understand whether their current CDN setup, or the lack of one entirely, is genuinely the bottleneck.
What It Does: Tests how quickly your page’s assets load from various global locations, with a particular focus on caching headers, compression, and CDN coverage, areas that matter enormously for sites serving an international audience.
Key Features: Its breakdown of caching headers and compression settings is more detailed than most general-purpose speed tools, useful specifically for diagnosing CDN or server configuration issues.
Pricing: Completely free.
Pros:
- Sharp focus on CDN and asset delivery issues other general tools gloss over
- Detailed caching header analysis genuinely useful for technical troubleshooting
- No account or signup required
Cons:
- Narrower scope than all-in-one tools like GTmetrix or PageSpeed Insights
- Less useful if your site does not use a CDN at all
- Does not cover Core Web Vitals scoring directly
Best for: Diagnosing CDN configuration and asset delivery issues specifically, especially for internationally distributed audiences.
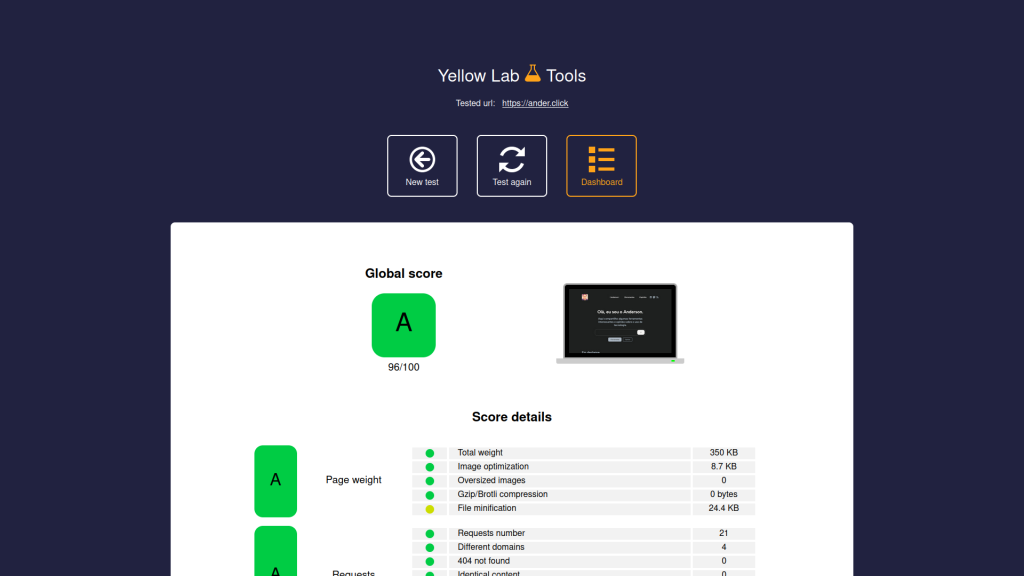
6. Yellow Lab Tools
Yellow Lab Tools takes a genuinely different angle, analyzing frontend code quality alongside speed, rather than just measuring load time alone. Most speed tools tell you that a page is slow and roughly which assets are involved, but stop short of examining whether the underlying code itself, messy JavaScript, an overly complex DOM structure, inefficient CSS, is quietly contributing to the problem beneath the surface. Yellow Lab Tools was built specifically to fill that gap, appealing particularly to developers who suspect the issue lives deeper in the codebase rather than simply in oversized media files.
What It Does: Beyond a speed score, it evaluates DOM complexity, CSS and JavaScript quality, font loading behavior, and the total number of requests, flagging specific frontend code practices that quietly contribute to slowdowns.
Key Features: Its grading breakdown by category, page weight, DOM complexity, CSS complexity, JavaScript complexity, gives a much clearer picture of where the actual problem lives in your codebase, not just that the page is slow overall.
Pricing: Completely free, with no signup required.
Pros:
- Uniquely focused on frontend code quality, not just raw speed metrics
- Detailed breakdown makes it easier to pinpoint whether CSS, JS, or DOM structure is the real problem
- Fast, simple, and free with no account needed
Cons:
- Less well known, meaning less community documentation compared to GTmetrix or PageSpeed Insights
- Does not include Core Web Vitals scoring directly
- Best suited for developers comfortable interpreting code-level feedback
Best for: Developers who want to understand whether frontend code quality itself, not just assets, is contributing to slow performance.
| Tool | Data Type | Free Tier | Best For |
| Google PageSpeed Insights | Lab and field data | Fully free | Core Web Vitals baseline |
| GTmetrix | Lab data | Yes, limited locations | Visual waterfall diagnosis |
| WebPageTest | Lab data, highly configurable | Fully free | Granular technical testing |
| Pingdom | Lab data, ongoing monitoring | Limited free test | Tracking regressions over time |
| KeyCDN Tools | Lab data | Fully free | CDN and asset delivery checks |
| Yellow Lab Tools | Lab data, code quality | Fully free | Frontend code quality analysis |
How to Fix Slow Load Times: The Real Causes
Running a test is only half the job. Here is what actually causes most of the slowdowns these tools flag, and how to fix each one.
Oversized, Unoptimized Images
Large image files remain one of the single biggest causes of slow load times across almost every website. Compress images before uploading, use modern formats like WebP or AVIF instead of older JPEG or PNG where possible, and implement lazy loading so images below the fold do not load until a visitor actually scrolls to them.
Render-Blocking CSS and JavaScript
Scripts and stylesheets that must fully load before the page can render anything create a noticeable delay before visitors see content. Move non-critical JavaScript to load after the main content, defer or async script tags where possible, and minify CSS and JavaScript files to reduce their size.
Slow Server Response Time (TTFB)
Time to First Byte measures how quickly your server begins responding at all, before any actual page content loads. A slow TTFB, generally anything above 0.8 seconds, points to hosting quality, an overloaded server, or inefficient backend code. Upgrading to better hosting or implementing server-side caching often resolves this directly.
Too Many HTTP Requests
Every image, script, and stylesheet your page loads represents a separate request, and a high volume of requests compounds delay, especially on slower connections. Combine multiple CSS or JavaScript files where possible, and remove unused plugins or scripts that add unnecessary requests without providing real value.
Missing Browser Caching
Without proper caching headers, returning visitors re-download the same assets every single visit instead of loading them instantly from their browser’s cache. Configure browser caching through your server settings or a caching plugin so repeat visits load dramatically faster.
No CDN for Global Audiences
If your audience is geographically spread out, serving assets from a single server location means visitors far from that server experience meaningfully slower load times. A CDN distributes your assets across multiple global locations, serving each visitor from the nearest one.
Quick Diagnostic Checklist
| Symptom in Test Results | Likely Cause | Fix |
| Large images flagged as an Opportunity | Unoptimized images | Compress and convert to WebP or AVIF, add lazy loading |
| Render-blocking resources warning | Blocking CSS or JS | Defer or async scripts, minify CSS and JS |
| High Time to First Byte | Slow server response | Upgrade hosting, enable server-side caching |
| Very high total request count | Too many HTTP requests | Combine files, remove unused plugins and scripts |
| Slow repeat visits in WebPageTest | Missing browser caching | Configure caching headers or use a caching plugin |
| Slow load times for distant visitors | No CDN | Implement a CDN for global asset delivery |
Why This Connects to Your Broader SEO Health
Page speed is not an isolated technical detail, it directly ties into Core Web Vitals, a confirmed ranking factor, and poor performance can compound with other technical issues on your site. If speed problems are showing up alongside other symptoms, unstable rankings, indexing issues, or crawl errors, our guide on 8 signs your website has a technical SEO problem covers the broader picture these speed issues often connect to.
Frequently Asked Questions
Conclusion
Testing your website’s speed is only useful if it leads to an actual fix. Google PageSpeed Insights, GTmetrix, WebPageTest, Pingdom, KeyCDN Tools, and Yellow Lab Tools each surface slightly different data, Core Web Vitals, waterfall detail, ongoing monitoring, CDN performance, and frontend code quality, but they all point toward the same handful of common, fixable causes, oversized images, blocking scripts, slow servers, too many requests, missing caching, and the absence of a CDN where one would help.
Run one test today, pick the single highest impact issue it flags, and fix that one thing before moving to the next. Speed improvements compound, and a handful of targeted fixes usually beats chasing a perfect score across every tool at once.
Ready to check your site? Run it through Google PageSpeed Insights right now, and use the checklist in this guide to turn whatever it flags into an actual fix today.
- 8 Signs Your Website Has a Technical SEO Problem
- Top 20 Free SEO Tools Every Website Owner Should Use
- 8 On-Page SEO Mistakes New Bloggers Make (And How to Fix Them)
- Why Is My WordPress Page Stuck on Discovered, Not Indexed

Behind every post at digiinte.com is a team of experienced SEO analysts and digital growth specialists. Our insights are backed by real data, industry research, and hands-on campaign experience — so you get advice that actually moves the needle.